Short note of Fortrat Diagram -Msc. II Semester
Here, today we are going to take a short note about the Fortrat diagram which is explained below in brief. If you want to know more about this you can search in wikkipedia which is aside in our blog options menu. Now, lets start this,
Normally Fortrat diagram is applicable in the diatomic molecules.
The frequency in wave number for P,R,Q branches in terms of parameters p and q is
ϑ ̅P,R = (ϑ ) ̅(ϑ',ϑ'')+((β' ) ̅ + (β' ) ̅')p+ ((β' ) ̅ + (β' ) ̅')p2 -------------------1
ϑ ̅Q = = (ϑ ) ̅(ϑ',ϑ'')+((β' ) ̅ + (β' ) ̅')q+ ((β' ) ̅ + (β' ) ̅')q2 ------------------------2
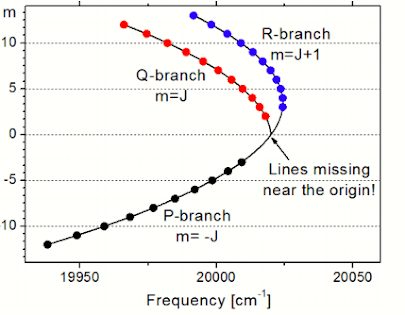
Each of these equations represents a parabola, p taking the both positive and negative values while q is positive only. These parabola are usually referred to as Fortrat parabola and these parabola are called the Fortart Diagram.
Fortrat diagram explain the multivariate nature of the rotational transition. The Fortrat diagram gives information regarding the rotational structure of the molecular spectra. This information is extremely important for the rotational chemistry. In general, the line of p- branch are densely distributed between the rotational quantum number to certain value and p-branch turns back thus more transition line form closer to the vertex of the parabola.
Symmetric and the dissymmetric properties of the molecules can be studied through the Fortrat diagram
The Fortrat diagram is as shown below.
(Source: https://cefrc.princeton.edu/sites/cefrc/files/Files/2013%20Lecture%20Notes/Hanson/pLecture7.pdf)Figure: Fortrat Diagram


Comments
Post a Comment